We examine Premier League title chasers' contrasting stats

Wednesday 13 February 2019 07:22, UK
How do Manchester City, Liverpool and Tottenham compare? We check the stats to see how the title contenders fare...
City and Liverpool are neck and neck atop the Premier League table on 65 points, with Pep Guardiola's side having played one game more and Tottenham sitting only five points adrift in third spot.
Temporary wobbles from the frontrunners appear to have created a three-way race - but what are the contenders' strengths and weaknesses? We take a look at each team's stats this season to find out...
The graphic below shows how Manchester City and Liverpool are far more attacking than Tottenham, with Spurs typically dominating the middle third of the pitch - having only two players averaging in the opposition half.
City's average positions disperse widely in opposition territory, with Fernandinho (No 25) controlling distribution and Leroy Sane (No 19) pushing furthest forward - creating a hotspot of activity down the left channel.
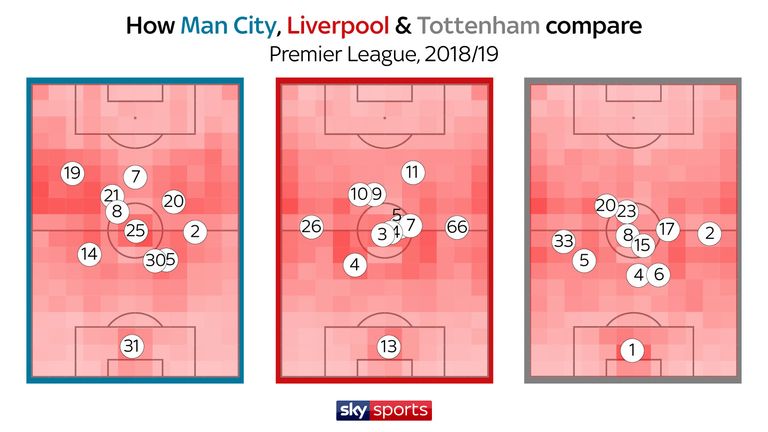
Six Liverpool players average along the halfway line, while Mohamed Salah (No 11) leads the line ahead of Roberto Firmino (No 9) and Sadio Mane (No 10) - with Virgil van Dijk being the only outfield player to average in his own half.
Spurs recede far deeper than their title rivals - with the exception of the two full-backs - relying on a cluster of central creativity from Christian Eriksen, Harry Winks and Dele Alli.

Manchester City are the league's goalscoring juggernauts once again with 74 league goals - boosted after demolishing Chelsea 6-0 at the Etihad on Sunday - totalling 15 goals more than the Reds and 20 more than Spurs.
Guardiola's side dominate across a raft of attacking stats, including shots, shots on target, chances created, dribbles, open-play crosses and touches in the opposition box.
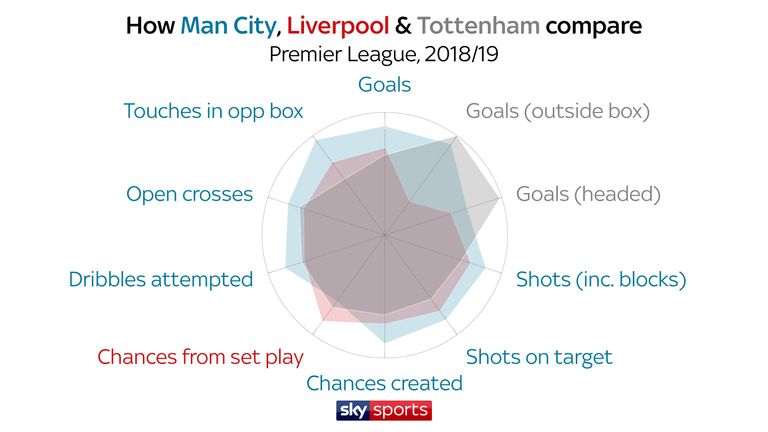
Liverpool create the most chances from set plays but rank second across numerous metrics - being least likely to fire crosses, score headed goals and find the back of the net from range.
Mauricio Pochettino's side take far fewer touches in the opposition box than their rivals, but are the most deadly from outside the box and in the air - scoring a league-topping 12 from range and 14 headers.

Unsurprisingly, City dominate the passing and possession stats, with the majority of those successful passes being made in the opposition's half - while also recording superior numbers for touches and duels won.
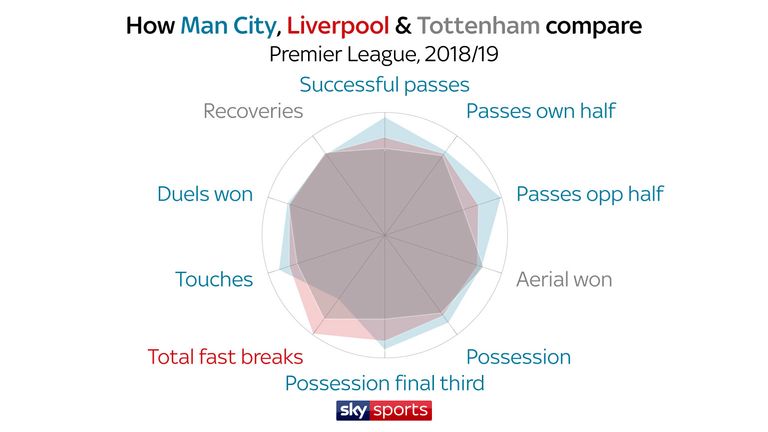
Liverpool only surpass City for fast breaks - attempting 20 to date and scoring in five of those attacks, while Spurs almost match their rivals for duels but record superior numbers for aerials and recoveries.

Liverpool and Tottenham have both relied heavily on their attacks to salvage points, with the Reds recouping 10 points from losing positions and Spurs collecting nine - while City have only picked up a single point after going behind.
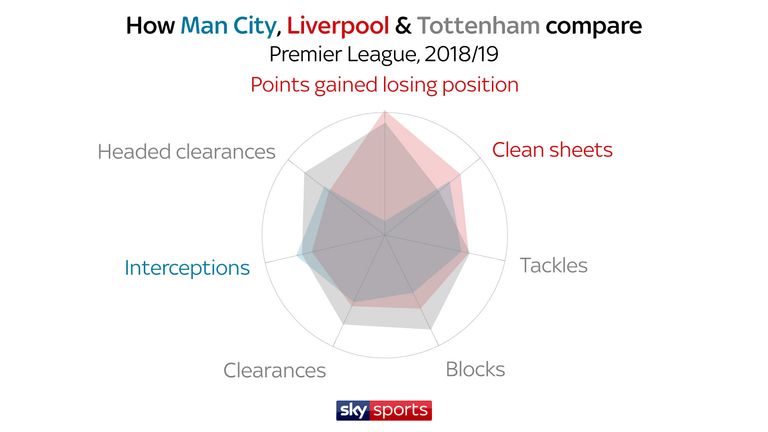
Liverpool top the league with 14 clean sheets but Spurs dominate the majority of rearguard stats, recording more tackles, blocks, clearances and headed clearances - while City lead for interceptions.

In terms of weaknesses, Spurs and Liverpool have each made two errors leading to goals, compared with City's sole error against Southampton in December.
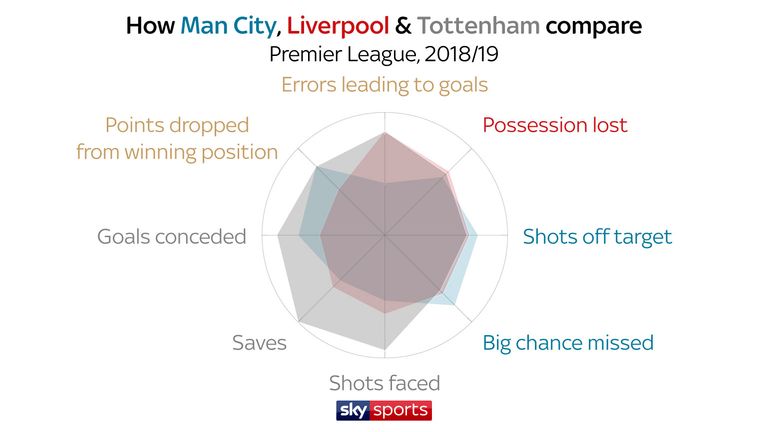
But City and Spurs have been more likely to let points slip from winning positions - each dropping nine, compared with Liverpool's six.
City's league-topping 183 attempts at goal contribute to a higher number of shots off target and big chances missed, while Spurs have faced more shots and conceded more goals - with Hugo Lloris being called into action far more frequently.
Guardiola's side emerge as the dominant force offensively and for retaining the ball, with the Reds building their title tilt upon an immaculate rearguard - while Spurs have balanced effectiveness at both ends of the pitch in a slightly more defensive system - but which will reign supreme come May?
If reading on skysports.com, comment below to get involved in the debate, but please adhere to our House Rules. If you wish to report any comment, simply click on the down arrow next to the offending comment and click 'Report'.