Magic Weekend 2021: How GPS statistics are proving to be a game-changer for Super League
In a UK first, Sky Sports will be utilising real-time GPS player insights as part of live coverage of the Betfred Super League's Dacia Magic Weekend on Saturday and Sunday. Those statistics are already giving greater insight than ever before to clubs and sports scientists

Thursday 2 September 2021 18:01, UK
When Opta started collecting team and individual player statistics for rugby league at the start of the Super League era, it opened up new way of understanding the key metrics behind how matches are played and won.
Stats such as metres made and average gains, line breaks and tackle counts are still widely utilised a quarter of a century later, but now the capability to collect physical performance numbers from players is taking that understanding to a whole new level.
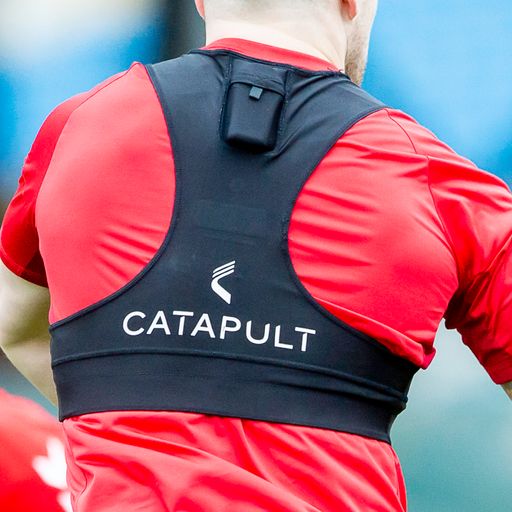
Small GPS tracking units worn by the players at all 12 Super League clubs collect a myriad of statistics throughout each game, and in a UK first Sky Sports will be bringing real-time metrics of distance covered, top speeds achieved, and game intensity to viewers during Magic Weekend.
As well as being utilised by the teams, the numbers feed into a central database which Super League and the England national team have access to and are giving deeper insights than ever before into player and team performance.
"In terms of the whole kind of evolution of our understanding, it started with looking at the game as a whole - the start to the 80 minutes, what does it look like," Professor Ben Jones, head of performance for the England national rugby league teams, said.
"We've then looked at the ball in play or out of play, what the attacking and defensive phases look like, and then what the hardest periods for each of those positions are.
"In effect, every person involved in rugby league knows what the hardest period is a player could be exposed to and that then helps them prepare for that.
One of the stand-out findings since this research began is that even with the introduction of rule changes like the shot clock, designed to reduce the length of stoppages in games, the physical outputs of players have remained the same even though the ball is in-play more.
That underlines the immense athletic ability of top-level rugby league players and while it is difficult to draw direct comparisons to football or other collision sports such as rugby union, American football and Australian rules football which use data collected by Catapult - the company which provides the wearable GPS trackers - there are elements which set the 13-man code apart.
"A lot of people will maybe compare the distance a football player has run and it's not uncommon to see a football player run north of 10KM," Catapult sports scientist Gordon Rennie said.
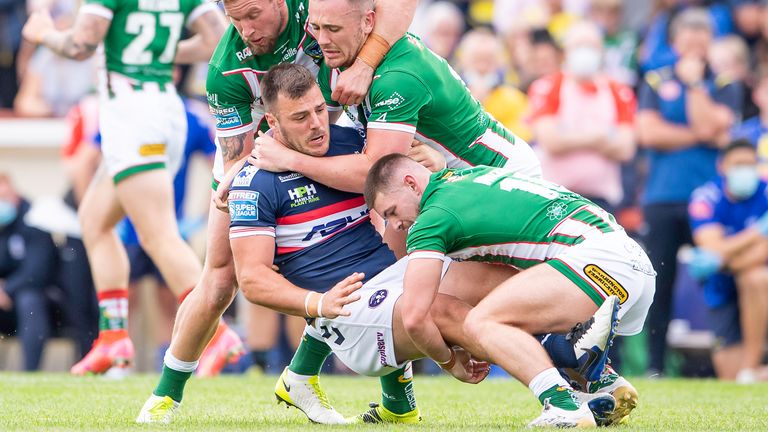
"But what we need to remember is the game is 10 minutes longer than rugby. Also, they don't have the tackle, the down and up and the wrestle - that's what really sets the sport of rugby league apart from other sports.
"I liken it to if you go out and run 5KM in 30 minutes, it's not that challenging to do and it's kind of a recreational pace. If you do a down and up at every single lamppost on that 5K, the distance is the same and the time might be the same, but…that is really going to take its toll.
"Where rugby league is set apart from these other field-based sports is that repetitive down, up, sprint back and go again."
Interpreting meaningful data from physical output goes beyond just looking at the bare numbers though. Context comes from understanding the effect the attacking and defensive phases of games can have.
For example, defending teams generally cover more distance than attacking teams, so a game where one team is particularly dominant in attack such as Leeds Rhinos in the 2015 Challenge Cup final against Hull Kingston Rovers would produce low levels of physical output for the attacking side.
As Jones puts it, the narrative is not 'if teams are intense then they will win', it is more 'if teams cannot be intense then they will lose'.
On an individual basis, young players who tend to be out of position more will generally cover more distance and metres than experienced players who know where to be. It is therefore key to recognise when players are being smart and being able to thrive in high intensity periods rather than survive in breaks.
Having this depth of analysis to player performance is leading to more integration of the work done by team coaching staffs and the strength and conditioning departments, bringing the sports science onto the training ground rather than those departments operating individually.
"Catapult allows us to observe the match stats but then understand what the players have to do within that," Professor Jones said. "I think that's the important thing which makes rugby league players unique.
"They have similar physical outputs as other sports and higher than some, but they still have to do the tackle, the wrestle, the 10-metre retreat and get up and down off the floor.
"That allows us to put together the contact training, the wrestling, as well as the physical outputs as well while still being able to perform the skills."
Along with player performance analysis, the data is used to help with injury prevention and tailor training workloads, although whether it can give teams an edge over their rivals is down to what the head coaches and their staff do with these statistics.
"That's the art of how they use it," Professor Jones said. "We've got to remember, our game is probably the most structured of any team sport - we pass backwards, we run forward, and we do it six times.
"What it's about then is how you can replicate the physical outputs players can be exposed to while doing the technical, the tactical and the skills, and blending it all together.
"That's where the good teams using this data will actually be thriving in these really hard parts because they're fit enough and do everything they need to do, as opposed to almost doing them separately."


