Jose Mourinho's reign as Manchester United manager in stats
Manchester United sack Jose Mourinho after back-to-back defeats against Valencia and Liverpool
Wednesday 19 December 2018 07:45, UK
Manchester United sacked Jose Mourinho after a run of poor form culminated in a crushing 3-1 defeat at Liverpool - but where did it go wrong? We check the stats...

Get Sky Sports Premier League and Sky Sports Football for just £18 a month
United have only collected 26 points after 17 games in the Premier League this season - the lowest tally at this stage of a campaign during the modern era.
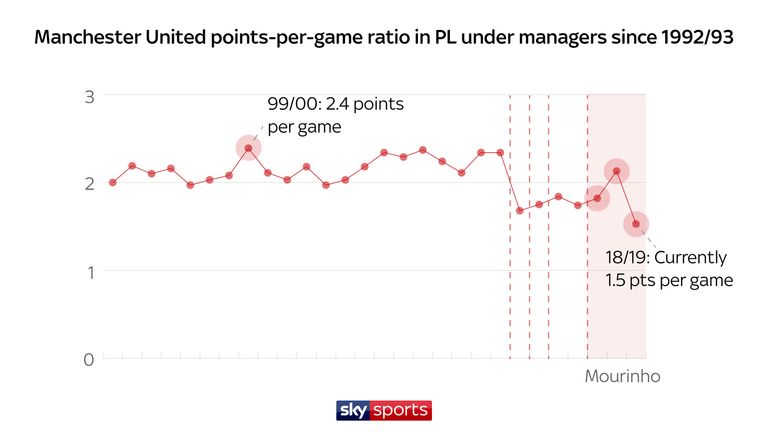
But stellar cup runs in his first season and an impressive runners-up finish in the Premier League last term boosted Mourinho's record, leaving the club with a win ratio of 58.3 per cent in all competitions.
That win rate surpasses predecessors Louis van Gaal and David Moyes - ranking behind only Sir Alex Ferguson's 59.7 per cent.
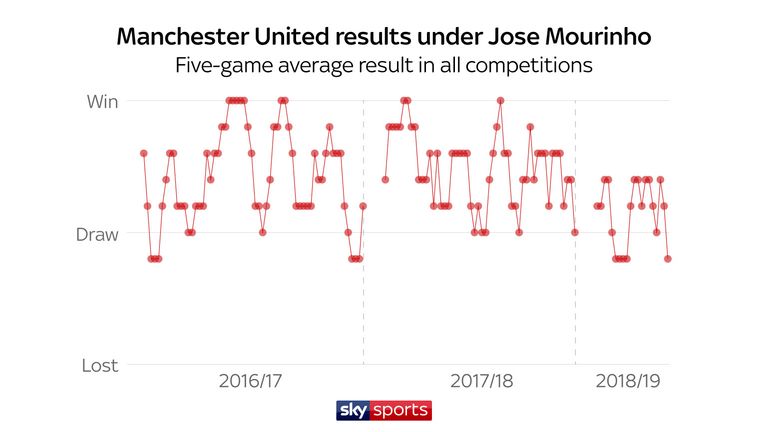
United hit form at this stage of the season during Mourinho's first term and achieved a fast start last time out, but have failed to find a purple patch during this campaign - sitting sixth in the league table, eight points adrift of Arsenal.
The graphic below suggests Mourinho's fate stemmed from defensive frailties, conceding twice as many goals per game this season compared with last term - having scored 29 and shipped 29 in the Premier League.
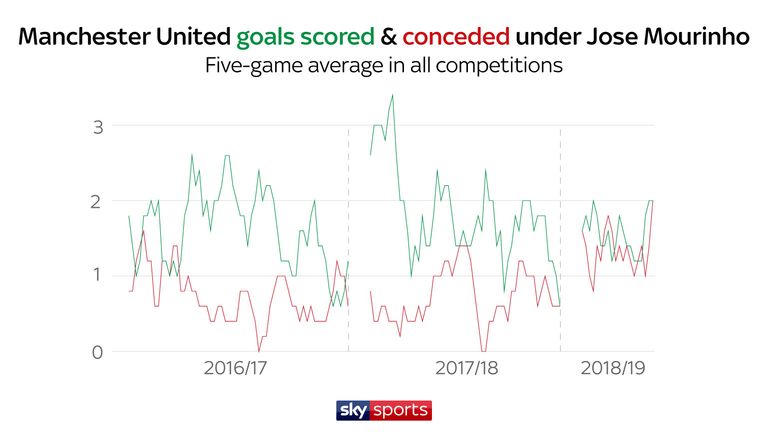
The Portuguese only claimed sixth spot in the Premier League during his first term at United after prioritising alternative silverware to claim the League Cup and Europa Cup.

Mourinho's second season produced his highest ratio of goals at United, scoring 1.8 per game in all competitions, while conceding just 0.7 goals per game for a second successive season to secure an impressive league finish.
But, despite Mourinho leaving the club with a season-low 41.7 per cent win ratio in all competitions, the two-time Champions League winner still ranks fifth for his all-time win rate of 62.3 per cent in the Premier League.
If reading on skysports.com, comment below to get involved in the debate, but please adhere to our House Rules. If you wish to report any comment, simply click on the down arrow next to the offending comment and click 'Report'.

