Have Manchester City improved in 2018/19 compared with 2017/18?
Has Pep Guardiola taken Man City to even greater heights in the Premier League?


Friday 17 April 2020 08:59, UK
Have Manchester City improved this season? We check the stats...
Pep Guardiola conquered the Premier League last season after just one year of rebuilding at City and his side currently top the table once again - but are they even better this term?
Goals scored, conceded and points
City thrashed Burnley 5-0 at the weekend, having thumped Cardiff by the same scoreline less than a month ago, and have only dropped points from two draws - against Wolves in August and Liverpool a fortnight ago.
Live MNF
As the graphic below shows, Guardiola made considerable progress in his second season for goals scored, goals conceded and points per game - and has improved all but the latter this term.
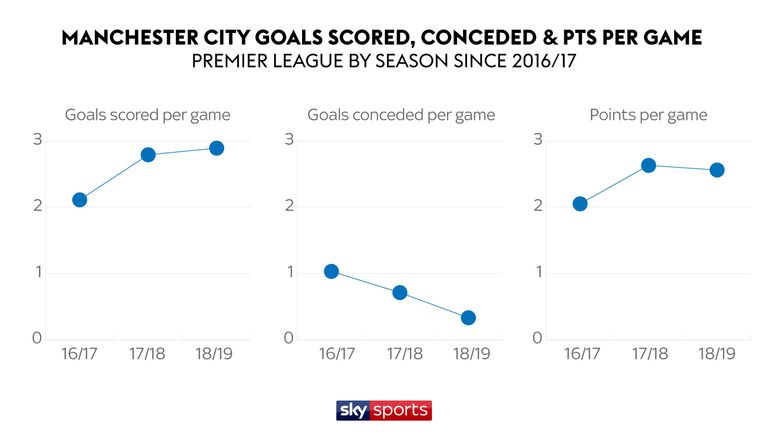
The biggest improvement this season has been a dramatic improvement defensively with just 0.3 goals conceded per game, while his side are also more potent in front of goal with 2.9 goals per game.
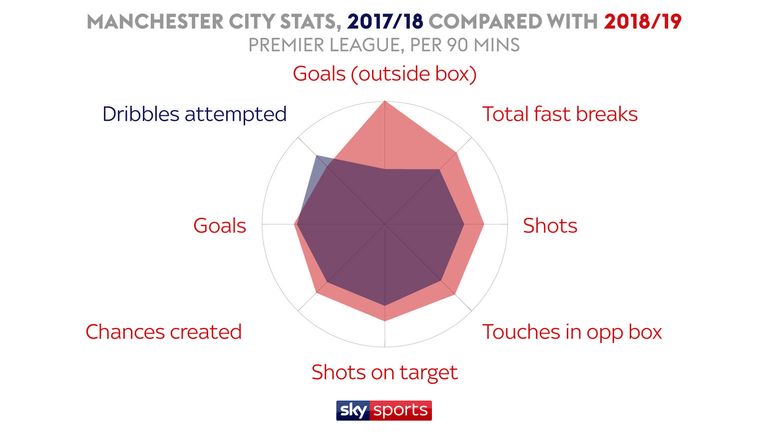
Match stats
The stats bear out City's improved scoring ratio with more fast breaks, chances created, shots, touches in the opposition area and goals from range.
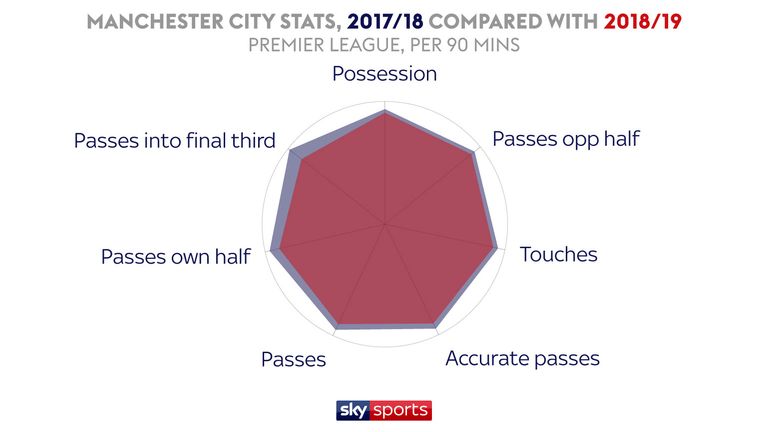
In terms of general play, City have actually dropped off slightly - recording fewer passes and touches and having a marginally lower proportion of possession.
Despite considerable defensive improvement, City have made fewer blocks, recoveries, tackles, aerials and duels per game this season - which suggests increased efficiency and players used (see below) have been the catalyst for progress.
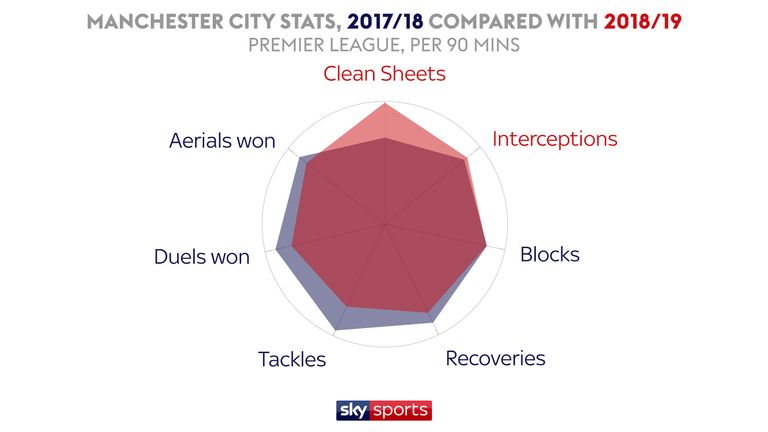
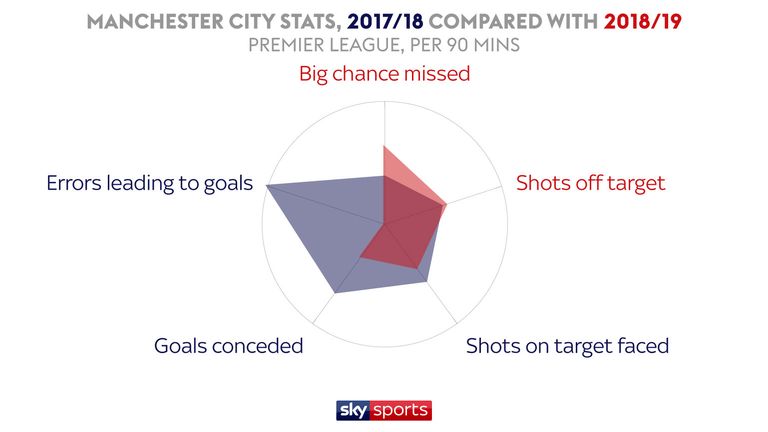
Again, the graphic below shows that City's attacking ascendancy has resulted in more big chances missed and shots off target, while facing far fewer shots and making no errors leading to goals.
Expected goals (xG)
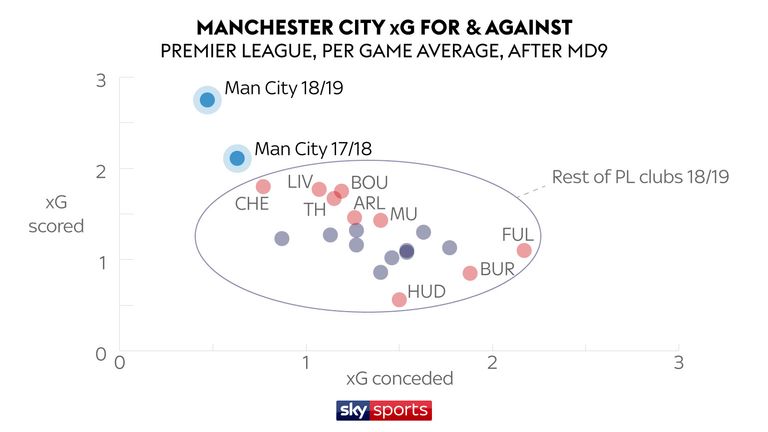
Opta's xG metrics reveal City's improvements in front of goal and defensively are not simply down to improved fortunes.
The team's expected goals ratio has soared from 2.1 goals per game last season to 2.8 goals during this campaign, while their expected goals conceded has plummeted from 0.6 to 0.4 per game.
As the graphic below shows, City are once again the standout team in attack and defence - having improved their xG in both metrics so far this season.
Players used
Last season, Guardiola started playmaker Kevin De Bruyne more than any other player in the Premier League, while also preserving his star man by hooking him off 11 times.
Other players to consistently start were 'keeper Ederson, Nicolas Otamendi, Fernandinho, Kyle Walker, David Silva and Raheem Sterling.
This season, January signing Aymeric Laporte, Ederson, Fernandinho and Sergio Aguero are the only players to have started every league game - with Laporte and Ederson completing every minute.
Interesting developments include the emergence of Phil Foden, who has made four substitute appearances, while Laporte appears to have ousted Otamendi as first-choice centre-back, typically partnering John Stones.
However, Otamendi started alongside Laporte in three successive league games against lower-table sides Fulham, Cardiff and Brighton - but has been an unused substitute on six occasions.
Summer signing Riyad Mahrez has increased rotation with Leroy Sane and Sterling, while Mendy has replaced Fabian Delph at left-back after recovering from an ACL injury, which restricted him to just three league starts last term.
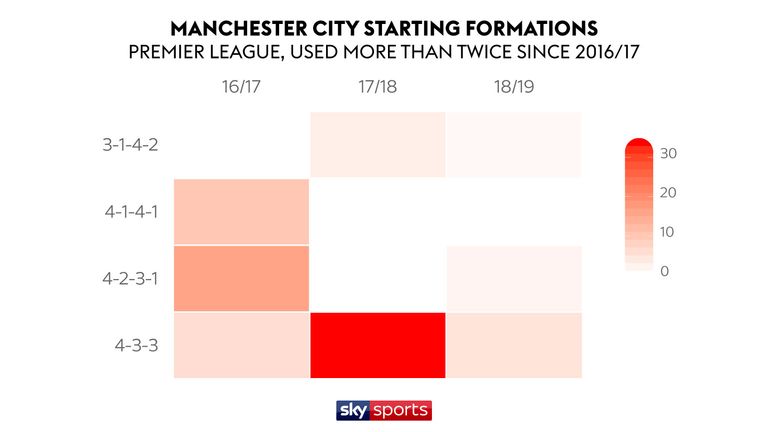
Formations
Guardiola has stuck to his preferred 4-3-3 formation this season, but appears willing to set up more defensively against tougher opposition, lining up against Arsenal and Liverpool in a 4-2-3-1 - having failed to use the system once last term.
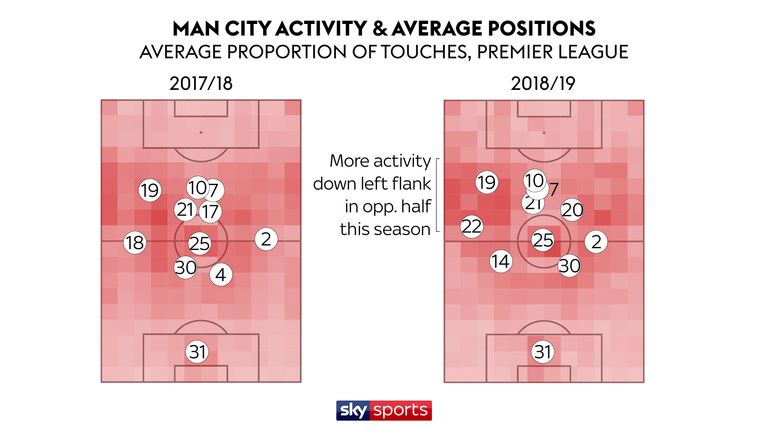
Activity & average positions
The graphic below reveals a notable area of increased activity on the left attacking flank during this campaign, with Sane tending to hug the flank more on this side, opposed to Sterling who typically darts into central, goalscoring regions from the right.
City's average positions are almost identical to their title-winning campaign last time out, with the exception of Bernardo Silva venturing slightly more to the right while De Bruyne has been sidelined with ligament damage.
So the stats reveal considerable progress defensively, marginal improvements offensively and absolute consistency on the pitch - in addition to becoming more flexible with defensive formations against stronger sides.
Guardiola appears to have taken City to even greater heights - but Guardiola's champions will face a stern test on Monday against a Tottenham side who have recorded their best ever start to a Premier League season.
Can City maintain their stat-topping returns at Wembley on Monday? Watch Tottenham v Manchester City live on Sky Sports Premier League from 7pm on Monday
If reading on skysports.com, comment below to get involved in the debate, but please adhere to our House Rules. If you wish to report any comment, simply click on the down arrow next to the offending comment and click 'Report'.